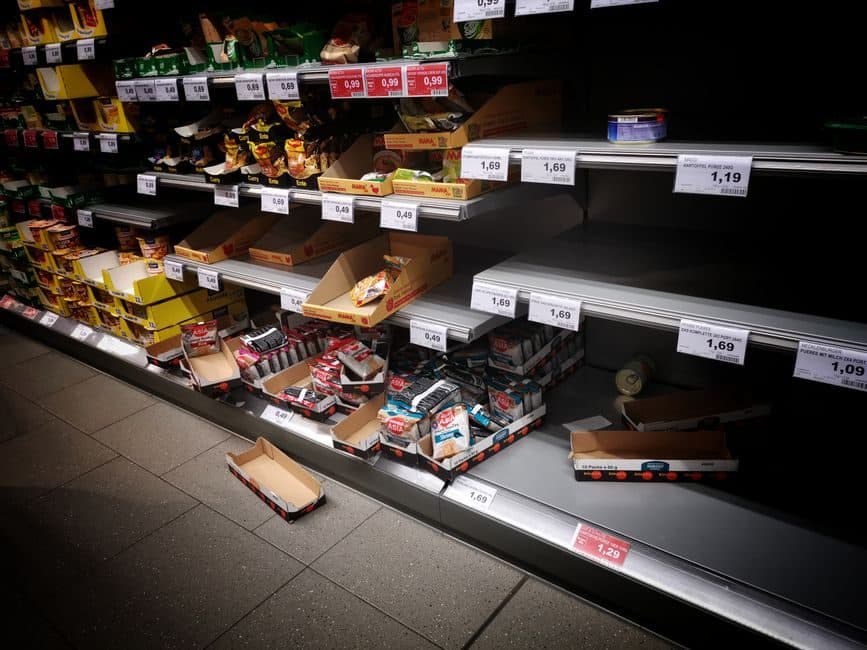
A 34-store regional grocery chain in Columbus, Ohio walked us through their Sunday-night ritual last winter. Every store manager pulled up a spreadsheet, eyeballed last week's sales, added a gut feeling about the weather, and typed in order quantities for 4,000-odd SKUs. It took each manager about three hours. And by their own estimate, they were wrong often enough that roughly 6% of perishable inventory hit the dumpster every week while another 4% of shelves sat empty during peak hours.
That's the retail paradox in one sentence: too much of the wrong thing and not enough of the right thing, at the same time, in the same store.
AI in retail gets talked about like it's about robots and cashierless stores. For most operators, it's far more boring and far more valuable than that. It's about getting the forecast right, moving stock before it rots, and stopping product from quietly walking out the door.
Why Retail Forecasting Is So Hard to Do by Hand
Demand is not a smooth line. It's a mess of overlapping signals, and a human staring at a spreadsheet can only hold two or three of them in their head at once.
A single Tuesday's demand for, say, bagged salad depends on the day of week, the season, whether it's the first of the month, the local high school football schedule, a competitor's promo two miles away, whether it rained, and whether you happened to run an endcap display last week that trained shoppers to look for it. Multiply that by thousands of SKUs across dozens of stores and you have a problem no manager can solve at 9pm on a Sunday.
This is exactly the kind of pattern-heavy, high-dimensional problem machine learning was built for. A forecasting model doesn't get tired at SKU number 900. It looks at years of transaction history, weather feeds, promotional calendars, and local events for every item in every store, and produces a probabilistic demand estimate.
The honest version: no model predicts demand perfectly. What a good one does is shrink the error. In the deployments we've seen across AI for retail projects, cutting forecast error by 20-30% is a realistic target, and that single improvement cascades into everything downstream.
Replenishment: Where the Forecast Actually Pays Off
A forecast on its own is a number on a screen. The value shows up when it drives an automatic order.
Here's the workflow that replaced the Sunday spreadsheet at the Columbus chain:
- The model generates a demand forecast per SKU, per store, for the next 14 days.
- It checks current on-hand inventory, in-transit orders, and supplier lead times.
- It calculates the reorder quantity that keeps each item above a safety-stock threshold without overshooting.
- It flags only the exceptions — the 3% of orders that fall outside normal parameters — for a human to review.
That last step matters. The goal was never to remove the manager. It was to stop the manager from re-deriving 4,000 obvious decisions by hand so they could spend their attention on the 120 that were genuinely ambiguous.
Six months in, that chain reported perishable waste down from 6% to roughly 3.5%, and out-of-stock incidents on their top 200 items down by about a third. The three-hour Sunday task became a 25-minute review.
Good AI for inventory management does the same thing across categories: it treats reorder points as living numbers that shift with demand rather than static thresholds someone set two years ago and forgot about.
Slow Movers and Dead Stock
Forecasting also works in reverse. The same model that spots rising demand spots the opposite — items whose velocity is quietly declining. Flagging a slow mover early, while there's still time to mark it down 15% instead of 60%, protects margin. A store that clears aging stock at a gentle discount recovers far more than one that discovers a pallet of expired product during a quarterly count.
Shrink: The Quiet Margin Killer
Shrink — the industry's word for inventory that disappears to theft, fraud, damage, and error — runs around 1.4-1.6% of sales for a typical retailer. On thin grocery margins, that number is often larger than net profit. It is the single most under-managed line in retail because it's invisible until you count.
AI attacks shrink from a few angles at once.
- Point-of-sale anomaly detection. Models learn what a normal transaction pattern looks like per cashier, per register, per hour. Sweethearting (ringing up a $2 item for a $40 basket), excessive voids, and refund fraud show up as statistical outliers rather than requiring someone to watch every lane.
- Inventory reconciliation. By comparing expected inventory (from sales and receiving data) against physical counts, the system localizes where shrink is happening — which store, which category, which shift — instead of leaving it as one big mystery number at year-end.
- Computer vision at self-checkout. Cameras trained to recognize items can catch the classic "scan the cheap avocado, bag the expensive steak" move without accusing every honest shopper.
One thing we tell every retailer: shrink analytics is where you have to be careful. These systems touch employees and customers, and a false accusation costs more than the theft. The right posture is to surface patterns for a human loss-prevention team to investigate, never to auto-punish.
You Already Have the Data
The most common objection we hear is "our data is a mess." It usually is. But retail generates enormous amounts of structured data as a byproduct of just operating — POS transactions, receiving logs, loyalty data, planograms. You don't need a perfect data lake to start. You need two or three years of transaction history and the willingness to clean it up as you go.
Where off-the-shelf tools fall short is the last mile — connecting the forecast to your specific ERP, your specific supplier EDI feeds, your specific store layout. That integration work is where a custom AI software build tends to earn its keep, because the generic SaaS dashboard rarely speaks fluently to the systems you already run.
How to Start Without Betting the Company
The failure mode in retail AI is the boil-the-ocean project: 18 months, seven figures, every store, every category, go live all at once. It almost always collapses under its own weight.
A saner path:
- Pick one painful category in a handful of stores. Perishables are usually the fastest to show ROI because waste is so visible.
- Run the model in shadow mode for 6-8 weeks. Let it make recommendations while humans keep ordering the old way. Compare. This builds trust and catches data problems before they cost money.
- Switch to auto-replenishment with human exception review. Measure waste and stockouts against your baseline.
- Expand category by category, store by store. Each rollout is easier than the last because the plumbing is already built.
The chain in Columbus didn't transform overnight. They started with produce in six stores, proved the number, and expanded from there. Two years later the Sunday spreadsheet is a story they tell new hires.
What Good Looks Like After a Year
Retailers who get this right tend to report a consistent cluster of outcomes: forecast error down 20-30%, perishable waste cut by a third or more, out-of-stocks on key items meaningfully reduced, and shrink brought under active management for the first time. None of these individually is dramatic. Together they can move a low-single-digit net margin by a point or two, which in retail is the difference between a good year and a bad one.
The stores that struggle are usually the ones that treated AI as a dashboard to admire rather than a workflow to change. The technology is the easy part now. The hard part is being willing to let the Sunday-night ritual die.
Frequently Asked Questions
How much historical data do we need before AI forecasting is useful?
Two to three years of transaction history is the practical minimum, mainly so the model can learn seasonal patterns and at least one full cycle of holidays and promotions. You can start with less, but expect the early forecasts to be rougher until the system has seen a full year of your business.
Will AI replace our store managers or buyers?
No, and the deployments that assume it will tend to fail. The realistic outcome is that routine, high-volume decisions get automated while your people spend their time on exceptions, supplier relationships, and judgment calls. The Columbus chain kept every manager; it just gave them back roughly ten hours a month each.
How is shrink detection different from just watching security cameras?
Cameras tell you what happened after the fact and require someone to watch them. AI shrink detection works on transaction data and localizes where losses are occurring — which shift, which register, which category — so your loss-prevention team investigates the right places instead of guessing. It's about narrowing the search, not accusing people automatically.
What's the difference between retail AI tools we can buy and a custom build?
Off-the-shelf tools are great for standard forecasting if your systems are standard. The moment you need the forecast to talk to a specific ERP, unusual supplier EDI feeds, or a store layout the vendor never imagined, a custom AI software approach usually delivers a better fit and lower long-term friction.
How quickly can we expect to see ROI?
If you start with a high-waste category like perishables and run a proper shadow-mode pilot, most retailers see measurable results within one to two quarters. Waste reduction shows up first because it's the most visible; forecasting and shrink gains compound over the following months as coverage expands.